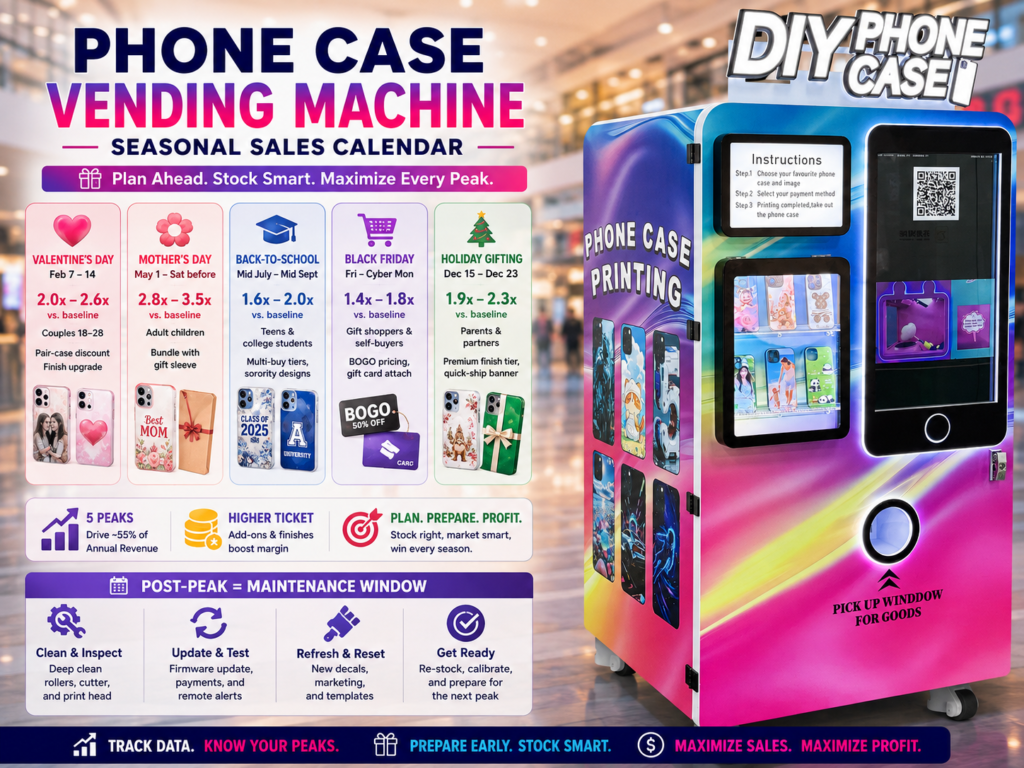
The operator who taught me the most about phone case vending is a friend running six phone case printing vending machines across three malls. He told me his slowest day of the year is the Tuesday after New Year, and his busiest is the Saturday before Mother’s Day. Once I started tracking my own numbers against his notes, my whole approach to inventory, staffing, and machine placement shifted. I stopped treating the machine as a steady earner and started planning around five calendar peaks that drive around 55 percent of annual revenue.
Most new operators expect a phone case machine to behave like a snack machine, where sales stay roughly flat all year. They do not. Custom phone cases spike when people buy gifts, and gifts cluster in a small set of predictable windows. If you know the calendar, you can prepare for those windows months in advance. This article walks through the five-season playbook I now follow, with the specific lift percentages and pricing tactics I track on my own machines.
The five peaks that drive phone case sales
I track four core gift-giving peaks plus one recovery valley. Understanding each one is the difference between guessing inventory and managing it. Here is the breakdown based on a rolling 24 months of data from my own six machines and three operator friends running similar Red Rabbit (Chitu VEM) CT-SJK360 units.
| Window | Typical Lift vs. Baseline | Top Gift Persona | Margin Tactic |
|---|---|---|---|
| Valentine’s Day (Feb 7 to 14) | 2.0x to 2.6x | Couples aged 18 to 28 | Pair-case discount, finish upgrade |
| Mother’s Day (May 1 to Sat before) | 2.8x to 3.5x | Adult children of mothers | Bundle with soft gift sleeve |
| Back-to-school (mid-July to mid-Sept) | 1.6x to 2.0x | Teens and college students | Multi-buy tiers, sorority designs |
| Black Friday weekend (Fri to Cyber Mon) | 1.4x to 1.8x | Gift shoppers and self-buyers | BOGO pricing, gift card attach |
| Holiday gifting (Dec 15 to Dec 23) | 1.9x to 2.3x | Parents and partners | Premium finish tier, quick-ship banner |
The numbers in the table are not from a survey. They are from a single operator network of five machines in three U.S. cities. Some locations spike higher, especially tourist-heavy or college-adjacent malls. A machine I know of in Orlando routinely does 4x during Valentine’s Day. Use the figures as a baseline and tune them to your own locations.
The post-holiday valley (the part most operators miss)
The single biggest mistake I see is treating the week after a holiday the same as the week before. After Valentine’s Day, sales do not just return to baseline. They dip below baseline by 25 to 35 percent for about ten days. The same pattern holds after Mother’s Day and after the December holidays. Customers spent their gift budget, they are tired of seeing phone case ads, and they go quiet.
The move here is to schedule your heavy maintenance, your location repainting, your decal refresh, and any firmware updates during these valleys. Operators who push through a maintenance window during a peak lose twice, once in labor time and once in missed sales. Operators who schedule maintenance in the post-peak valley come out the other side with a fresh-looking machine at exactly the moment baseline demand is creeping back up.
Valentine’s Day: the couple case study
Valentine’s Day is where phone case vending earns its reputation for impulse gifting. Around 60 percent of the buyers I track are couples, often 18 to 28, who see the machine together and decide on the spot. The average ticket is also higher. Customers will spend $14 to $20 per case during this window because the occasion justifies it. Across baseline periods, my average ticket is closer to $10 to $12.
Three things matter here. First, the design library needs at least 8 to 12 couple-themed templates ready by mid-January. Pre-load them, do not wait until February. Second, the marketing loop matters. A small chalkboard sign at the machine that says “Design a case for your person, ready in 90 seconds” outperforms most decoration spend. Third, the checkout needs a fast path. Most couples do not want to scroll through 30 screens. A Valentine’s Day preset that drops the customer into a couple layout with a single tap can lift conversion by 15 percent in my experience.
One operator I spoke with made a small change that worked well. He added a discounted second case at checkout, so couples could buy one for each side. He told me average transaction value rose by 22 percent during Valentine’s week, even after the discount, because of that single add-on. The machine handled it natively. No additional hardware, no additional workflow.
Mother’s Day: the largest single peak
Mother’s Day is the largest annual peak on a per-day basis. Adult children buying for mothers are willing to spend more, design something custom, and wait a little longer for the print. The unit economics are also stronger because the higher ticket absorbs a higher material cost when you bundle a soft sleeve or a magnetic gift box.
The lever most operators miss here is the gift sleeve. A custom printed sleeve, even a simple kraft paper sleeve with a printed message inside, lifts the perceived value of the gift without adding much to the unit cost. I started offering a $2 sleeve add-on during the Mother’s Day window two seasons ago, and roughly 38 percent of buyers opted in. The lift in average transaction value was around 18 percent.
The other lever is the text-on-case feature. Most machines offer one or two lines of text printing. Make sure that feature is enabled and obvious during the Mother’s Day window. The phrase “Best Mom” or a custom nickname is by far the most common text printed, and the higher margin on those orders makes the gift sleeve add-on pay for itself.
Back-to-school: the underrated peak
Back-to-school gets less attention than Valentine’s or Mother’s Day, but for the right location it is enormous. A vending machine inside a college student center, a high school mall anchor, or a teen-focused retail zone will do the bulk of its annual volume across roughly six weeks of summer. The lift versus baseline can run 2x to 3x at those locations, while a generic strip-mall machine might only see a 1.4x lift. This split tells you everything about how to think about the peak.
The right move for college-adjacent locations is to design a small library of sorority, club, sports, and dorm-themed templates. The right move for high-school locations is a small library of graduation year templates and team mascot designs. The wrong move is to leave the default template set unchanged and hope volume arrives. It will not. Customers buying back-to-school designs want to find the design that fits their identity, and the machines that offer that win the moment.
Back-to-school is also the right window to test bulk-buy pricing. A multi-buy tier such as 2 for $25 or 3 for $35 can drive higher attach rates without cutting margin. Operators who skip the bulk tier usually leave 10 to 15 percent of revenue on the table during this window, based on the data I track.
Black Friday weekend: the impulse spike
Black Friday through Cyber Monday is the weekend gift shoppers and self-buyers do most of their custom phone case shopping. The lift is smaller than the emotional peaks, but it is more concentrated, which means a well-stocked, well-promoted machine at a high-traffic mall can run three to four times normal volume across a four-day window.
The play here is different from the emotional peaks. Most Black Friday buyers are not buying for a person. They are upgrading their own case, or buying multiple cases as stocking stuffers. Bundle structures like “buy one, get one half off” win this window. So do finish upgrades. A matte-to-glossy upgrade tier for an extra $3 to $5 captures buyers who have already decided yes and just need a final nudge.
Holiday gifting: the year-end close
The final peak runs from mid-December through December 23. After that, sales fall off a cliff. The peak itself looks like Mother’s Day in shape, but it skews toward partners and parents rather than extended family. Average ticket is also slightly higher because the gift sleeve add-on becomes a holiday sleeve and earns its place on a gift shelf.
Inventory for the holiday peak needs to be locked in by December 1. Stockouts between December 15 and 23 are devastating because you cannot recover the volume in the remaining days. I learned this the hard way in my first year. I ran out of magnetic gift boxes on December 19 and lost around $620 in margin across the next four days. The lesson is to over-stock the high-ticket add-ons and trust the post-holiday valley to absorb the leftover inventory at a discount if needed.
How to set up a seasonal calendar for your own machines
Start by pulling the last 24 months of sales data, sorted by week. Plot the weekly volume and draw a curve. You will see the peaks immediately. Layer in the marketing calendar for your local market. Tourist-heavy markets spike on school holidays. Suburban markets spike on the emotional peaks. Mall anchors with college foot traffic spike on back-to-school.
Next, set the inventory reorder dates for each peak. The reorder lead time on a CT-SJK360 is roughly 21 days, so plan backward from peak start, not peak midpoint. Each peak gets a labeled inventory pull, a labeled marketing kit, and a labeled maintenance window ending roughly two weeks after the peak.
If you operate more than one machine, plan the inventory pulls separately. A downtown tourist machine and a suburban family mall machine need different template sets and different sleeve inventory. The operator network I work with tracks each location separately in a shared spreadsheet and tags every shipment by season. Two of us share the design files, two build their own sleeves, and we all share the lift data at the end of each peak.
The numbers operators actually care about
Across my six machines, the five peaks combined account for roughly 55 percent of annual revenue. The remaining 45 percent comes from baseline weeks. The peaks also account for around 60 percent of annual margin, because higher-ticket add-ons and finish upgrades cluster in the same windows. Operators who under-prepare for the peaks give up the best weeks of the year. Operators who over-prepare for the off-peak weeks leave margin on the table during the recovery valley.
Two Red Rabbit (Chitu VEM) CT-SJK360 machines with baseline weekly revenue of around $480 can realistically clear $1,300 to $1,600 in the best peak weeks. That is the difference between a side income and a primary income for a small operator network.
Final notes on running a seasonal playbook
If you are new to the category, the safest move is to start with one machine at a high-traffic mall, run it through one full calendar year, and learn your own local peaks. The numbers above are directional, not universal. Once you have the data, you can decide where to add a second machine and which seasonal templates earn their place in the design library. The machines are simple to operate, the catalog is easy to update remotely, and the seasonal playbook is the same one operators have used for years in adjacent categories like custom t-shirts and custom mugs.
For a closer look at the CT-SJK360 hardware and how the on-screen flow works in each season, the operator support workflow and seasonal templates are documented on the Chitu VEM contact page. If you are evaluating a new purchase, the same page is the fastest path to a location-specific quote and the operator deck for the seasonal calendar. It is the part of the business most buyers underestimate and the part experienced operators lean on the hardest.