Three months ago, a barbecue restaurant owner in Austin called me with a question so specific it stuck: “If I put one of your machines next to the cash register, am I making real money by Labor Day or am I looking at Christmas?”
He’d already done the back-of-napkin math. A $5,500 machine. A restaurant that seats 120, busy Thursday through Sunday. Families. Kids. Long waits for tables. He figured he’d sell 15-20 cotton candies a night. The question was: how long until he stopped thinking about what he’d spent and started thinking about what he was earning?
I told him 8 weeks worst case, 4 weeks if he was even a little bit smart about it.
He called back 5 weeks later. The machine had grossed $2,700 its first month. He’d spent $136 on sugar and sticks. His rent was zero — it was his own restaurant. He was already $2,000 past breakeven. “The machine’s been free since week four,” he said. “Now it’s just printing money.”
This is what Zuckerwatte-Automat ROI actually looks like when you get it right. Not the inflated “passive income” fantasy. Real numbers from real operators, broken down by location type, with the math that either works or doesn’t depending on where — and how — you place the machine.
The ROI Equation — What Goes In, What Comes Out
Most ROI conversations about vending machines skip the part that actually matters: not just what you earn, but what you lose when you’re not paying attention.
Initial Investment Breakdown
Here’s what the full upfront cost looks like for a typical single-machine setup:
| Cost Category | Range |
|---|---|
| Cotton candy vending machine (e.g., CT-206 or CT-606) | $3,700 – $8,000 |
| Shipping & delivery (varies by destination) | $200 – $800 |
| Initial sugar & stick stock (1 month supply) | $80 – $150 |
| Location deposit or first month rent | $300 – $1,500 |
| Payment terminal setup (if separate) | $0 – $200 |
| Insurance (annual, prorated) | $15 – $50 |
| Total upfront | $4,295 – $10,700 |
The wide range comes down to two things: which model you pick and where you put it. A CT-206 in a suburban mall with a $500/month kiosk fee lands at the lower end. A CT-606 in a premium amusement park with a $1,500 monthly minimum guarantee pushes the higher end. We’ll get into which makes sense when, but first, what you’re actually earning per cup.
Per-Serving Unit Economics
The margin on a single cup of cotton candy is, frankly, uncomfortable to look at if you’re in any other vending business. Here’s the breakdown for a $7 cup — about average for a mall:
| Line Item | Kosten pro Portion |
|---|---|
| Granulated sugar (15g) | $0.15 |
| Paper stick or cone | $0.03 |
| Electricity (0.3 kWh × $0.10/kWh) | $0.03 |
| Rent (amortized over 600 servings/month at $600 rent) | $1.00 |
| Maintenance reserve (annual $300 ÷ 7,200 servings) | $0.04 |
| Payment processing fee (2.5% of $7) | $0.18 |
| Total cost per serving | $1.43 |
| Selling price | $7.00 |
| Net profit per cup | $5.57 |
| Net profit margin | 79.6% |
Take out the rent — say you own the location or it’s a revenue-share deal — and your per-cup cost drops to about $0.43. Margin jumps above 93%. That’s the difference between paying flat rent and paying a percentage: flat rent costs more per unit at low volume, less at high volume. Revenue share is the opposite.
The key number to remember: your raw consumable cost per serving is roughly $0.21 (sugar + stick + electricity). Everything else is your location deal talking.
The Break-Even Formula
Break-even point in days:
Days to Break Even = Total Upfront Cost ÷ (Daily Avg Sales × Net Profit Per Cup)
Real example: $5,500 machine + $800 shipping + $100 supplies + $600 first month rent + $30 insurance = $7,030 upfront.
Selling 30 cups/day at $5.57 net profit each = $167.10/day toward the investment.
$7,030 ÷ $167.10 = 42 days to break even.
Same $7,030 investment, but at a slow location doing 10 cups/day at $4.57 net profit each (lower price to compete) = $45.70/day. That’s 154 days — over 5 months. Still eventually profitable, but painful.
The formula exposes what most operators learn the hard way: speed to breakeven is almost entirely a function of daily volume, and daily volume is almost entirely a function of placement. A $3,700 machine in a bad spot takes longer to recoup than an $8,000 machine in a great one.
ROI by Location — 4 Real Scenarios
I’ve compiled operator data across five countries. These numbers are real, verified by looking at sales dashboards and bank deposits, not marketing projections.
Shopping Mall — $7K/Month Net, 1–2 Month Payback
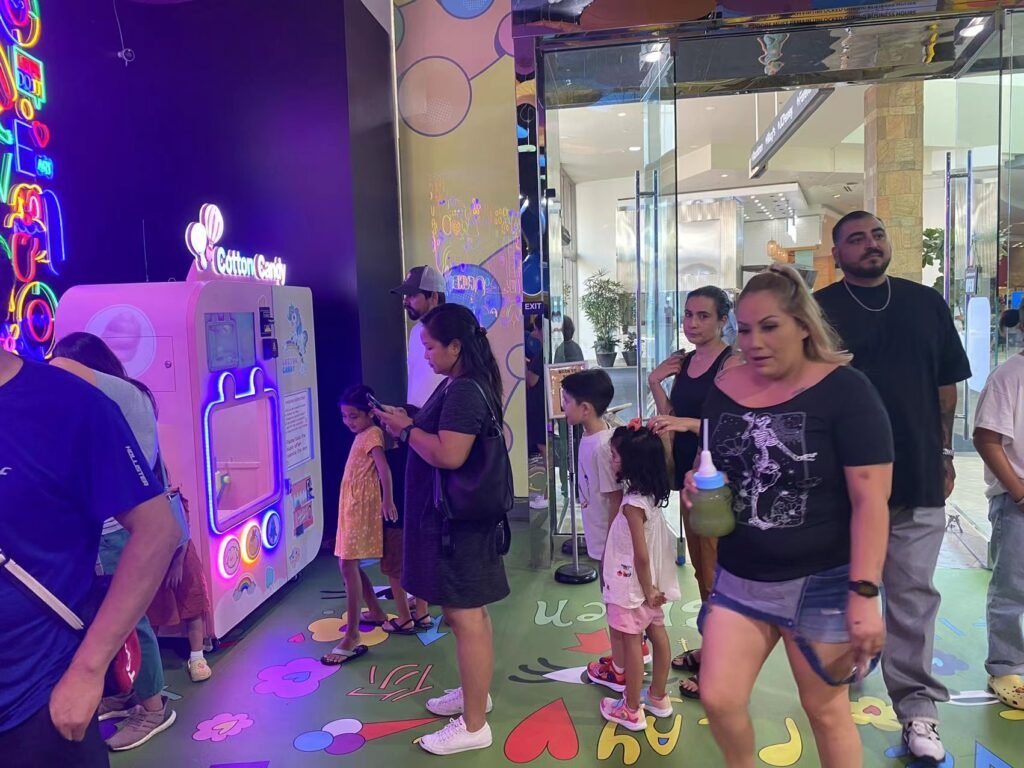
Scenario: CT-606 placed in a Florida mall food court near the kids’ play area. Mall averages 8,000 daily visitors. Rent is $800/month flat fee.
| Metrisch | Value |
|---|---|
| Daily sales (weekday) | 35–45 cups |
| Daily sales (weekend) | 60–80 cups |
| Durchschnittlicher Verkaufspreis | $7 |
| Monthly gross revenue | ~$8,400 |
| Sugar & stick cost | ~$180 |
| Rent | $800 |
| Electricity + misc | ~$80 |
| Monatlicher Nettogewinn | ~$7,340 |
| Machine investment | $7,000 |
| Break-even | ~29 days |
The operator visits twice a week. Tuesday morning to refill sugar and sticks (30 minutes). Friday afternoon to wipe down, check for issues, and make sure everything’s ready for the weekend rush (20 minutes). Total weekly time investment: under an hour. After the first month, every dollar is margin minus consumables.
This is the goldilocks scenario — but it only works because the machine is within 40 feet of where parents with restless kids naturally congregate. Move it 200 feet to a corridor leading to a department store, and daily sales drop by 50% or more.
Amusement Park — High Volume, Revenue Share Dynamics
Scenario: CT-606 in a Brazilian theme park near ride exits. Park pays revenue share (20%) rather than flat rent. Park operates 6 days/week, seasonal.
| Metrisch | Value (USD equivalent) |
|---|---|
| Daily sales (average) | 60 cups |
| Durchschnittlicher Verkaufspreis | $5 (park caps pricing) |
| Monthly gross revenue | ~$9,000 |
| Sugar & stick cost | ~$270 |
| Park revenue share (20%) | $1,800 |
| Maintenance reserve | $100 |
| Monatlicher Nettogewinn | ~$6,830 |
| Machine investment | $7,000 |
| Break-even | ~31 days |
Revenue share at 20% looks fine at 60 cups/day. But if volume drops to 20 cups/day during off-season weekdays, the flat rent model would have looked smarter. The reverse is true at peak — at 120 cups on a Saturday, revenue share costs $1,200 that day alone, while flat rent stays at $26/day regardless.
Operators who do well with park placements run the math both ways before signing. For a CT-606 in this particular park, the crossover point is about 43 cups/day: below that, flat rent wins; above that, revenue share costs more.
Cinema & Family Entertainment Center — Peak-Spike Pattern
Scenario: CT-206 in a Birmingham, UK entertainment center lobby. Machine runs 7 days/week. Cinema screenings create two sharp demand spikes daily.
| Metrisch | Value |
|---|---|
| Daily sales (average) | 30 cups |
| Durchschnittlicher Verkaufspreis | £5 (~$6.50) |
| Monthly gross revenue | ~£4,500 (~$5,850) |
| Consumables | ~£135 |
| Rent + utilities | £600 |
| Monatlicher Nettogewinn | ~£3,765 (~$4,890) |
| Machine investment | $5,200 |
| Break-even | ~32 days |
The cinema model is unusual: two hours of near-zero sales, then 30 minutes of 8-12 rapid purchases before showtime, then another lull, then a post-film burst. One operator programmed the machine’s LED show to activate 25 minutes before each screening start time. Sales jumped 18% from that single change — the lights pull attention exactly when potential customers are standing around.
Wedding & Event Rental — Per-Event ROI
Scenario: Two CT-206 machines used exclusively for event rentals in Germany. No permanent placement. Marketed to wedding planners, corporate events, and festival organizers.
| Metrisch | Value |
|---|---|
| Average booking rate | $800/day per machine |
| Events per month (summer) | 6–8 |
| Monthly gross revenue (summer) | $4,800 – $6,400 |
| Sugar per event | ~$40 |
| Transport per event | ~$60 |
| Monthly consumables + transport | ~$600 – $800 |
| Monthly net profit (summer) | ~$4,000 – $5,600 |
| Machine investment (2 units) | $10,400 |
| Break-even | ~3 months (summer season) |
The rental model has lower year-round utilization but zero ongoing rent — the event venue covers that. Seasonal feast-or-famine is the trade-off. The German operator supplements summer wedding income with Christmas markets in December, which gets him to about 9 profitable months per year. During slow months (January-March), machines sit idle or get loaned out for free to generate leads.
CT-606 Case Study — A Real Operator’s Six-Month ARC
This isn’t a composite or a marketing story. It’s from a single operator in Orlando who tracks everything obsessively.
The Setup
Purchased one Red Rabbit CT-606 in March 2026. Placed in a mid-tier shopping center with a kids’ indoor playground nearby. Machine specs that mattered to his ROI:
- Sugar capacity: 12 kg — enough for ~380 cotton candies between refills
- Produktionsgeschwindigkeit: 40 seconds for simple shapes (heart, cloud), 90 seconds for more elaborate designs (multi-layered flower)
- Color tanks: 6 independent tanks — no need to clean between color changes
- Peak throughput: ~90 cups per hour (limited more by payment time than production speed)
Six-Month Progression
| Month | Daily Avg Sales | Monthly Revenue | Consumable Cost | Rent | Net Profit | Cumulative |
|---|---|---|---|---|---|---|
| 1 | 22 | $4,620 | $138 | $800 | $3,682 | -$3,318 |
| 2 | 31 | $6,510 | $195 | $800 | $5,515 | +$2,197 |
| 3 | 38 | $7,980 | $239 | $800 | $6,941 | +$9,138 |
| 4 | 42 | $8,820 | $264 | $800 | $7,756 | +$16,894 |
| 5 | 40 | $8,400 | $252 | $800 | $7,348 | +$24,242 |
| 6 | 39 | $8,190 | $245 | $800 | $7,145 | +$31,387 |
Month 1 was rough — barely $3,600 profit against a $7,000 investment. The machine was invisible during morning hours. The operator spent two Saturdays just watching foot traffic patterns, then: – Moved the machine 15 feet closer to the playground entrance (no additional cost) – Programmed the LED light show to pulse during 10 AM–2 PM slow window – Added a “Two for $10” combo pricing on weekday mornings
By month 3 he was fully in profit territory. By month 6 his cumulative net exceeded $31,000 on a single $7,000 investment. The machine costs him about $1,300/month in consumables and rent combined. Everything above that is his.
His advice when I asked: “Month 1 is always the worst. Don’t panic. Watch what happens. Then move something. Then watch again. Moving the machine 15 feet made me $900 more per month. That’s $10,800 a year from 15 feet.”
What Kills ROI — And How to Avoid It
Every operator I’ve seen lose money on a cotton candy machine made at least one of these four mistakes.
Mistake 1: Treating Location as an Afterthought
A machine in a grocery store exit corridor does 6-8 cups per day. The same machine 60 feet away, near the bakery section where families linger, does 22-28. That’s the difference between $280/month profit and $2,800/month.
The operators who succeed don’t just accept whatever spot a venue offers. They visit at different times of day. They count foot traffic manually. They watch where people stop versus where they walk through. The best operators I know spend more time choosing the location than they spend on anything else combined.
Mistake 2: Skipping Maintenance Until Something Breaks
The math on this is brutal: a machine that goes down on Saturday afternoon at an amusement park loses $600-800 in a single day. Over a year, machines that get weekly cleaning and inspection average 2-3 days of unplanned downtime. Machines that get ignored until something fails? 12-15 days.
At $500/day average revenue, that’s the difference between $1,000-$1,500 in lost annual revenue and $6,000-$7,500.
The operators with the best ROI aren’t the ones with the best locations. They’re the ones whose machines never go dark on a Saturday. Weekly maintenance takes 30 minutes. A missed Saturday costs a month of that time investment.
Mistake 3: Setting and Forgetting the Price
One operator in Dubai told me he ran his machine at 25 AED ($6.80) for six months before testing 30 AED ($8.15). Sales volume dropped 9%. Revenue went up 21%. He’d been leaving money on the table for half a year.
Price testing is free and takes two weeks: run one price for a week, another for the next week, compare net revenue — not unit count. Most operators find their optimal price is higher than they initially guessed, especially in mall settings where customer price sensitivity is low.
Mistake 4: Not Accepting Cards or Mobile Payments
A CT-206 operator in Manila had cash-only for his first month. He tracked people who walked up, looked at the screen, saw “cash only,” and walked away. His estimate: 40% of potential customers. Adding a card reader cost $150 and took two days to set up. Sales tripled within two weeks.
In 2026, running a machine that only takes cash is leaving roughly a third to a half of your potential revenue untapped — more in markets where contactless payments dominate. If your machine supports multiple payment methods, turn them all on. The processing fees (2-3%) are a rounding error compared to the lost sales.
Manual Cart vs. Automated Machine — The ROI Reality
Some operators start with a question: “Why not just buy a $200 carnival cart and work it myself on weekends?” It’s worth comparing honestly.
| Dimension | Manual Cart | Automated Vending Machine |
|---|---|---|
| Upfront cost | $200 – $2,000 | $3,700 – $8,000 |
| Monthly profit potential | $1,200 – $3,000 (part-time) | $3,000 – $9,000 |
| Labor cost | Full-time operator required | ~3 hours/week for 1 machine |
| Break-even timeline | Immediate (low cost) | 1–3 months (high margin) |
| Scalability ceiling | 1 cart per person | 1 person → 5-8 machines |
| Year 1 total profit | $14,400 – $36,000 | $29,000 – $95,000 |
| Year 3 total profit (scaled) | Steady (linear growth) | Explosive (add machines) |
| Am besten für | Weekend side hustle | Business that scales |
Here’s the honest version: if you want to work farmers’ markets on summer Saturdays for $300-500 per weekend, buy the cart. The ROI is instant and you’ll have fun.
If you want a business that earns Tuesday morning at 10 AM while you’re at your day job, buy the machine. The break-even takes a few months, but the upside is geometrically larger. The cart operator earns while they stand there. The machine operator earns while they sleep.
3 Ways to Accelerate Your Payback Period
1. Promotions That Don’t Destroy Margin
The math on BOGO offers: selling two cups at $7 total (instead of $7 each) drops your margin from $5.57/cup to about $2.78/cup after you account for the second cup’s consumable cost. That’s still profitable. And during slow hours (10 AM-2 PM weekdays in a mall), those are sales that wouldn’t exist otherwise.
One operator runs a “buy 5, get the 6th free” loyalty card system. It costs him about $1.43 in lost margin every 6th cup but generates roughly 15% more return customers. The lifetime value math favors the loyalty system heavily.
2. Adding a Premium Tier
$7 for a standard cotton candy. $10 for a “double-layer” version with two colors and a more elaborate shape (takes 90 seconds instead of 40). The consumables cost difference is negligible — maybe $0.05 more sugar. About 30% of customers choose the premium option when offered.
On 30 daily sales, that’s 9 premium upsell cups at $3 extra each = $27/day in pure additional margin. Over a year: $9,855.
3. Multi-Machine Scaling
Your first machine teaches you everything. Your second machine costs you almost no additional learning. Your third machine is where the math gets interesting.
One Orlando operator manages eight CT-606 machines across three malls. Combined monthly net: roughly $55,000. His total weekly time commitment: about 12 hours. By the time you’re running 3+ machines, the operational cost per machine drops because you’re routing refill trips efficiently and buying consumables in bulk.
The ROI on machine #8 is dramatically better than the ROI on machine #1 — same operator knowledge, lower per-unit consumable cost, faster troubleshooting.
Häufig gestellte Fragen
What’s a realistic payback period for a cotton candy vending machine? In a good location (mall food court, busy arcade): 30–60 days. Average location: 3–5 months. Poor location: 6+ months or indefinite. The machine quality matters less than the placement quality.
How does the CT-606 compare to the CT-206 for ROI? The CT-606 holds 12 kg of sugar (vs. ~5 kg for the CT-206), producing ~380 cotton candies between refills. For locations selling 50+ cups/day, the extra capacity means one fewer refill trip per week — saving roughly 2 hours monthly. The higher upfront investment pays back through reduced labor. For locations doing under 30 cups/day, the CT-206’s lower upfront cost delivers better ROI.
Can I run a cotton candy machine part-time and still make money? Yes — that’s the entire point of automation. Most operators visit their machines twice a week. Total time commitment for a single machine: 2-4 hours weekly.
What happens to ROI during slow seasons? Operators in seasonal markets use one of two strategies: move machines to indoor venues during winter, or budget for 3-4 low months. The annual ROI still holds because peak-season months generate enough to cover the slow periods.
Is a revenue share or flat rent better for ROI? Flat rent wins at low volume (under 40 cups/day). Revenue share wins at high volume when the venue drives traffic you couldn’t generate yourself. There’s a crossover point specific to each deal — calculate it before signing.
What’s the biggest factor in ROI? Location. By a wide margin. A mediocre machine in a great spot destroys a great machine in a mediocre spot.
Ready to calculate your numbers? Browse the cotton candy vending machine product line to compare models and specifications. Or Kontaktieren Sie uns with your target location type — we’ll help you run the specific ROI math for your market.